


stability than ice Ih
Outline
(1) Water Potential
(2) Crystallization and Ice-i
(3) Free Energies and Phase Diagrams
(4) References
(1) Water Potential
One of the primary research interests in our group is the utilization of computer simulations to study the phase behavior of lipids and lipid membranes. These are challenging systems to study due to the large size of the resulting structures and the time required for the phases of interest to develop. Since computer power is always a limitation, techniques need to be utilized that make these simulations more tractable. One method used by our group is coarse-grain simplification. In the case of lipids, the process is demonstrated in the figure to the right.
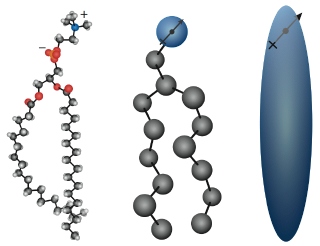 Here, we group the atoms of a multipoint molecule into fewer and
fewer points. Decreasing the number of particles in the systems
reduces the number of interactions which need to be calculated,
increasing our ability to explore the overarching phase
space. Thus, by sacrificing some fine detail, we can hopefully
improve our understanding of the larger-scale cooperative
interactions that influence the phase behavior of these
systems. Sometimes this loss of detail can be rather
problematic, particularly in the case of water.
Here, we group the atoms of a multipoint molecule into fewer and
fewer points. Decreasing the number of particles in the systems
reduces the number of interactions which need to be calculated,
increasing our ability to explore the overarching phase
space. Thus, by sacrificing some fine detail, we can hopefully
improve our understanding of the larger-scale cooperative
interactions that influence the phase behavior of these
systems. Sometimes this loss of detail can be rather
problematic, particularly in the case of water.Water is an essential component in simulations of biomolecular systems. Water makes up the bulk of the molecules involved, and the hydrogen bond networking of the solvent is often considered an essential aspect dictating the phase behavior of lipid systems. In choosing a water model to utilize in our research, we looked to a model that is computationally simple and efficient, yet still captures the hydrogen bond networking effect. Thus, the soft-sticky dipole (SSD) was selected as the explicit solvent that we would utilize in our research.[1] The SSD model differs from other simple water models in that it is a single point model, and it requires one distance calculation and three pair-interactions between two molecules. For comparison purposes, TIP3P, the most commonly used water model in biomolecular simulations, is a three site model that requires nine distance calculations and 10 interactions. The interaction potential is given as follows:
Thus, the potential is the sum of three pair-interactions (from left to right): Lennard-Jones for van der Waals interactions, dipole instead of charge-charge interactions, and a sticky potential to mimic the tetrahedral hydrogen-bonding. The sticky potential consists of the sum of two spherical harmonics, an empirical term to counter dipole alignment in the first solvation shell, and switching functions to turn these interactions off at certain radial distances.
When performing the first SSD simulations in this research, it was discovered that the water model exhibited densities significantly lower than the experimental density of 0.997 g/cm3 at 298 K. These initial results showed that a complete reparametrization of SSD was required for use both with and without a reaction field (an interaction correction that compensates for truncation effects).[2] The newly parametrized potentials (SSD/E and SSD/RF) involve a contraction of the Lennard-Jones surface, strengthening of the dipole moment, and modification of the sticky potential to reduce particle repulsion. The effects of the modifications to the sticky potential can be seen in the comparative isosurfaces below.
| SSD & SSD1 Isosurface | SSD/E & SSD/RF Isosurface |
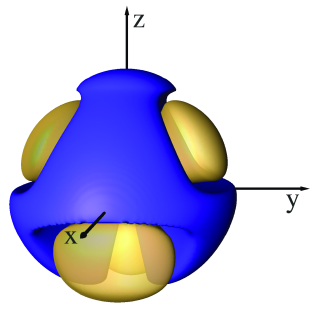 | 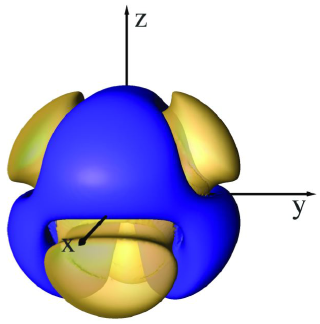 |
| Property | SSD1 |
SSD/E |
SSD1 (RF) |
SSD/RF |
Expt. |
| Density (g/cm3) | 0.999(0.001) |
0.996(0.001) |
0.972(0.002) |
0.997(0.001) |
0.997 |
| Cp (cal/mol K) | 28.80(0.11) |
25.45(0.09) |
28.28(0.06) |
23.83(0.16) |
17.98 |
| D (10-5 cm2/s) | 1.78(0.07) |
2.51(0.18) |
2.00(0.17) |
2.32(0.06) |
2.299 |
| Coordination Number (nC) | 3.9 |
4.3 |
3.8 |
4.4 |
4.7 |
| H-bonds per particle (nH) | 3.7 |
3.6 |
3.7 |
3.7 |
3.5 |
| tau1 (ps) | 10.9(0.6) |
7.3(0.4) |
7.5(0.7) |
7.2(0.4) |
5.7 |
| tau2 (ps) | 4.7(0.4) |
3.1(0.2) |
3.5(0.3) |
3.2(0.2) |
2.3 |
(2) Crystallization and Ice-i
While performing the water parametrizations described above, several systems of SSD/E underwent crystallization events from a super-cooled liquid state in isothermal-isobaric ensemble simulations. These events are marked by sudden shifts in the simulation properties, such as a decrease in density or drop in the system potential energy. It is visually apparent that ordered regions developed from the initially disordered system - note the diagonal rows in the crystal on the right in the image below.
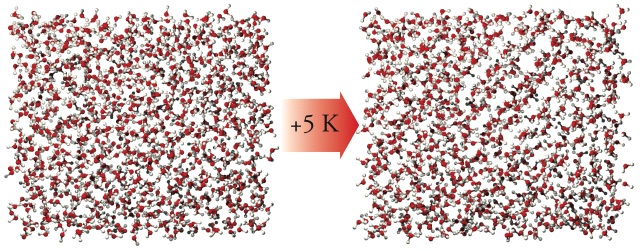
Note that the diagonal rows do not propogate through the entire crystal and seem to stop about halfway across the cell. This is due to the fact that the system crystallized well below the melting point, and it became locked in a fractured state - looking along another plane, you would be able to pick out some order in the glassy regions. From these fractured solid systems, we were able to piece together and relax an ideal crystal. It was determined to be an ice polymorph that has not yet been observed in either experimental or theoretical studies. The following rendering shows what this new ice polymorph, which we are calling Ice-i, looks like when viewing it down on the (001) crystal face:
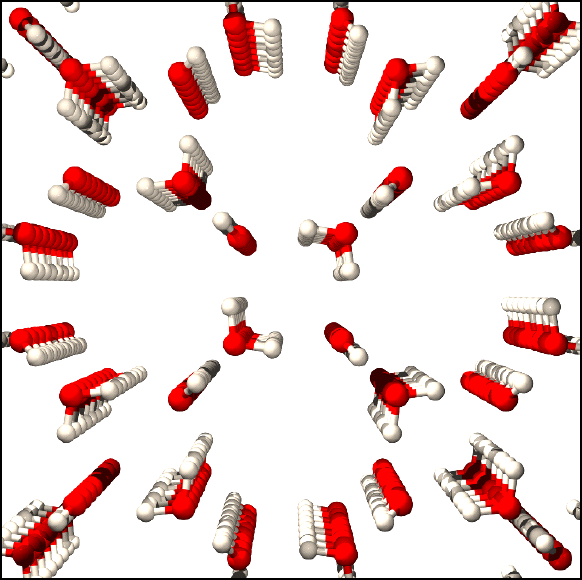
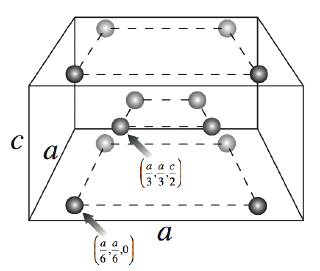
The crystal is composed of rows of water tetramers that interlock in such a fashion to result in open octagonal cavities. The diameter of these open cavities is on average approximately 6.3 Å. These large empty volumes make the crystal considerably less dense than any other known or observed ice polymorph. In fact, it is ~7.5% less dense than ice Ih, the lowest density variant of ice on record. The unit cell for this structure is quite simple, consisting of 8 molecules in a stacked square arrangement:
Spontaneous crystallization of a solid in constant pressure simulations is a very good indicator that the structure is the minimum free energy structure for the SSD/E water model. In order to verify this, as well as to evaluate the significance of this crystal structure for all water models, we needed to determine the free energy and compare it to the free energies of other common ice crystals. By comparing the free energies of the various polymorphs under common pressure and temperature conditions, we can understand which crystalline phase is thermodynamically preferred for that particular model and thus, which form we would expect it to adopt under unrestricted dynamics.
In order to perform this free energy comparison, the computational technique of thermodynamic integration was used on several different ice polymorphs. Thermodynamic integration is an established technique that has been successfully used in the past to evaluate the free energies of both liquid and solid phases of water.[4-6] Since our internal dynamics code is already based on rigid body orientational propagation, applying the method used by Báez and Clancy was relatively straightforward.[5] Basically, our system is transformed into a system where the partition function can be solved for analytically (an Einstein crystal for solids). We know the free energy at the transformed state and can determine the change in free energy during the transformation; thus, with this information, it is easy to back out the free energy of the initial system. This process was used on five different low pressure ice polymorphs (ice Ih, ice Ic, ice B, Ice-i, and Ice-i´) using six different common water models (TIP3P, TIP4P, TIP5P, SPC/E, SSD/E, and SSD/RF). Results for the initial 9 Å cutoff simulations are shown in the following table:
Click on the crystal images for a more detailed view.
In all of these simulations, Ice-i (or Ice-i´) has the lowest free energy for all of the water models studied. Another interesting point is the fact that the melting temperatures (with the obvious exception of SSD/E) show reasonably good agreement with the experimental value of 273 K, i.e. much better than the values observed for TIP4P from ice Ih (from 214 to 238 K).[7-9] An important distinction to note is that these melting transitions are calculated from the most stable phase (Ice-i or Ice-i´ in this case), and calculation of the Tm from ice Ih from this work places TIP4P's melting transition at ~210 K - in line with the estimates from other groups.
With the free energies at one or more state points, we can project out to other temperatures using the Gibbs-Helmholtz equation and other pressures using the pressure dependence of the free energy.[6] This allows us to generate phase diagrams for the various models. With phase diagrams, we can get an idea of what transition is in store for your system under the chosen conditions. Below are phase diagrams for TIP3P and SSD/RF as determined from this data:
| TIP3P Phase Diagram | SSD/RF Phase Diagram |
|---|---|
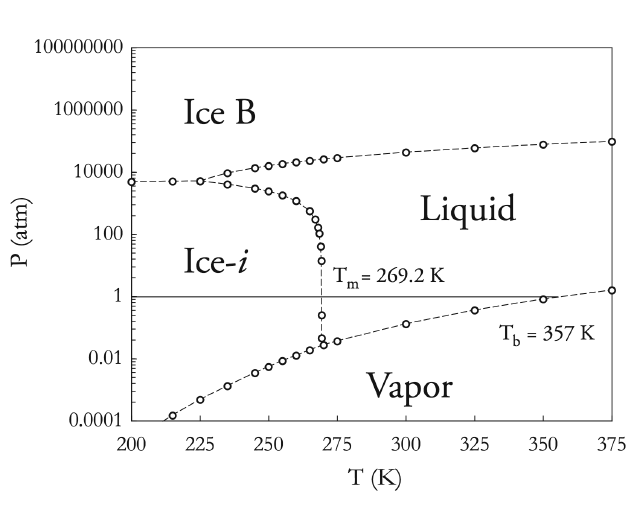 |
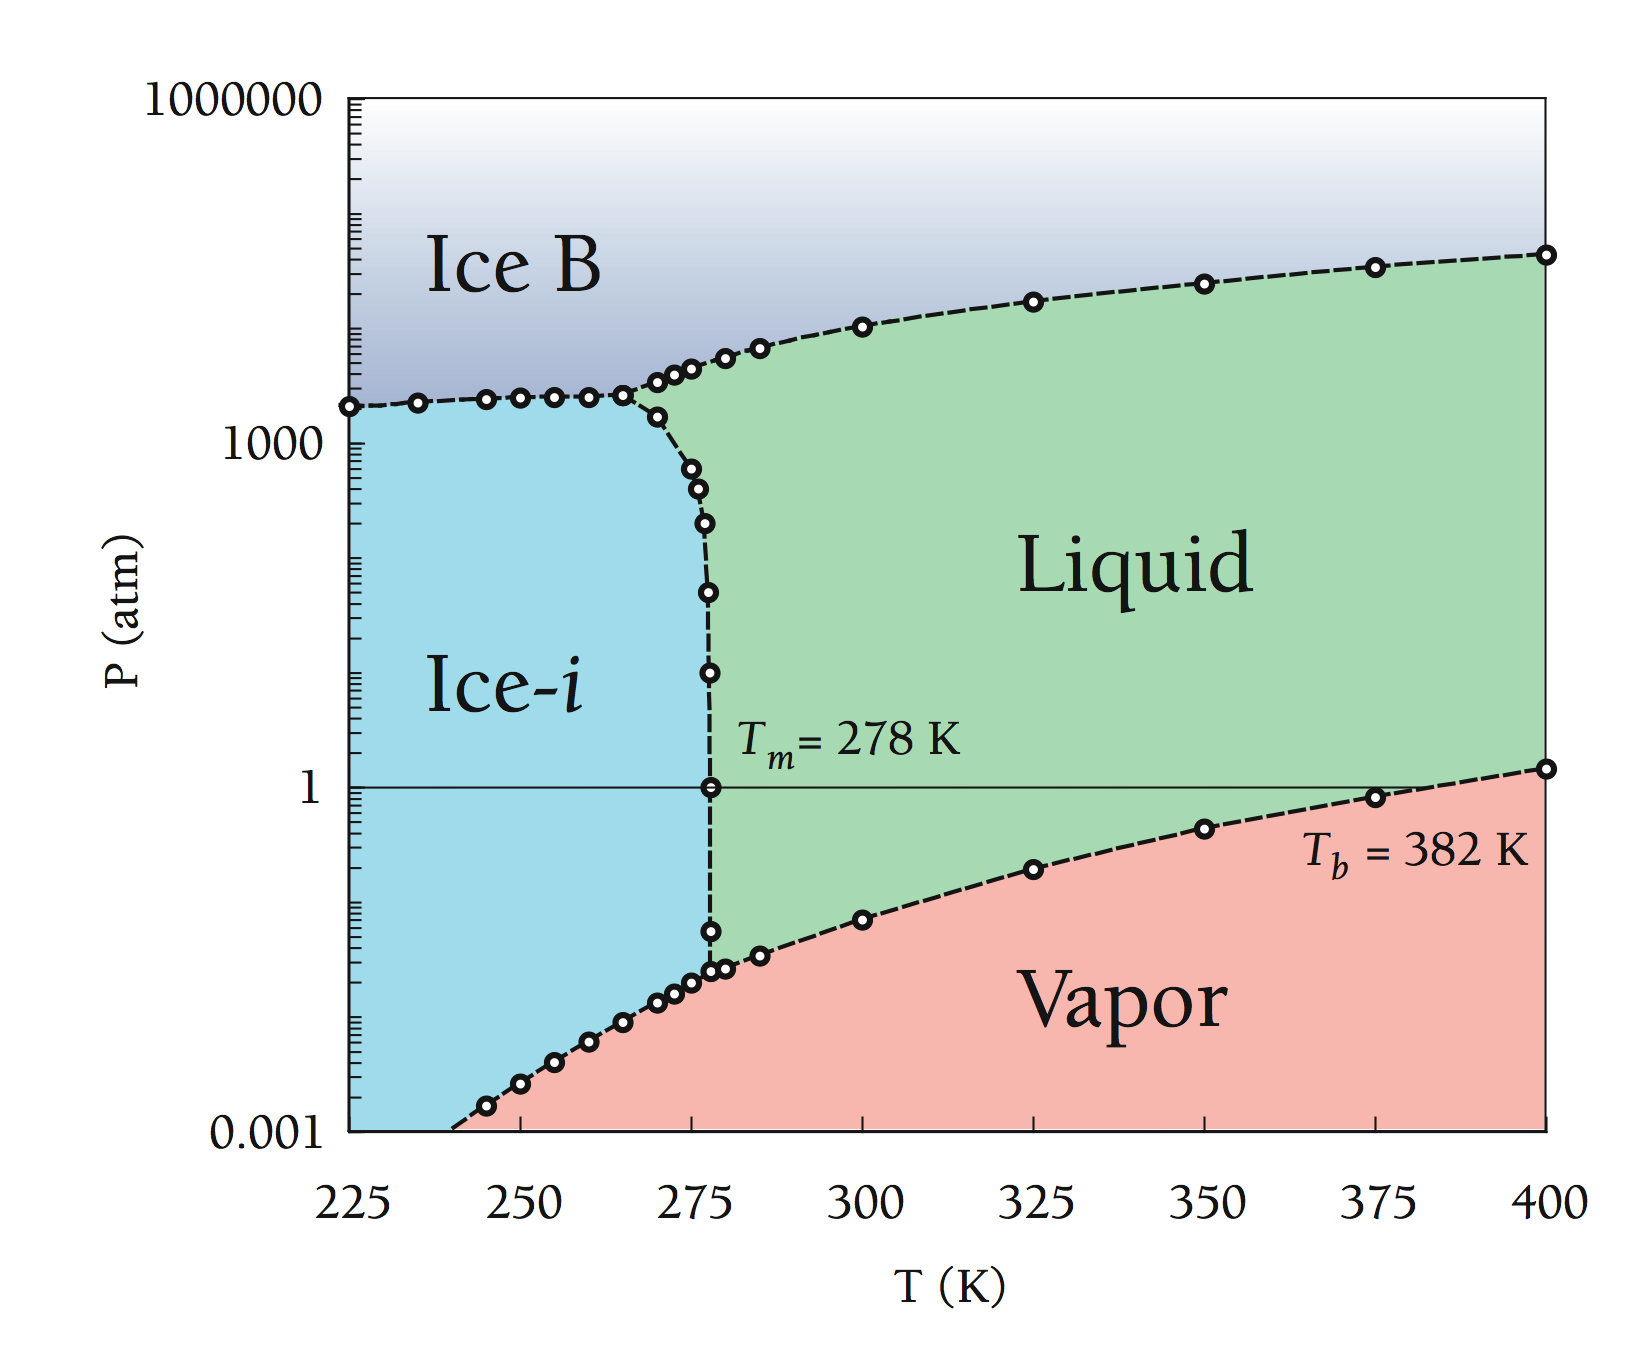 |
 Additional tests were performed in order to gauge the effect of
the long-range interaction truncation on the free energy
results. The cutoff radii in simulations of the most
computationally efficient water models (3 particles or less)
were increased systematically to determine the free energy
dependence. In addition, a long range correction (in the form of
a reaction field or Ewald summation) was incorporated to
estimate the effect of infinite periodicity. The results of
these tests are plotted in the figure on the right.
Additional tests were performed in order to gauge the effect of
the long-range interaction truncation on the free energy
results. The cutoff radii in simulations of the most
computationally efficient water models (3 particles or less)
were increased systematically to determine the free energy
dependence. In addition, a long range correction (in the form of
a reaction field or Ewald summation) was incorporated to
estimate the effect of infinite periodicity. The results of
these tests are plotted in the figure on the right.Note that Ice-i loses some of its relative stability when moving out to longer cutoff radii in nearly all cases. In fact, with the SPC/E model, each of the studied polymorphs spends some time as the minimum energy state at differing cutoff radii. In spite of this initial look, Ice-i looks to be the minimum energy polymorph regardless of conditions for TIP3P and the single point water models. It is also a stable polymorph for SPC/E, and the differences of free energy between the various polymorphs that simulation conditions (such as the volume in canonical ensemble simulations) may have an effect in what polymorph is expressed during crystallization.
(4) References
[1] Liu, Y.; Ichiye, T. J. Phys. Chem. 1996, 100, 2723-2730.
[2] Fennell, C. J.; Gezelter, J. D. J. Chem. Phys. 2004, 120, 9175-9184.
[3] Tan, M.-L.; Fischer, J. T.; Chandra, A.; Brooks, B. R.; Ichiye, T. Chem. Phys. Lett. 2003, 376, 646-652.
[4] Hermans, J.; Pathiaseril, A.; Anderson, A.; J. Am. Chem. Soc. 1988, 110, 5982-5986.
[5] Báez, L. A.; Clancy, P. Mol. Phys. 1995, 86, 385-396.
[6] Báez, L. A.; Clancy, P. J. Chem. Phys. 1995, 103, 9744-9755.
[7] Sanz, E.; Vega, C.; Abascal, J. L. F.; MacDowell, L. G. Phys. Rev. Lett. 2004, 92, 255701.
[8] Vlot, M. J.; Huinink, J.; van der Eerden, J. P. J. Chem. Phys. 1999, 110, 55-61.
[9] Gao, G. T.; Zeng, X. C.; Tanaka, H. J. Chem. Phys. 2000, 112, 8534-8538.
Click here to return to the top of the page.